
Bollinger bands are a tool for technical analysis. It is show the deviation of the price of shares, currencies or commodities. John Bolinger is a famous analyst, and the trader developed this indicator in the 80’s. This tool helps to make decisions both in traditional Forex markets and in make a deals on binary options. Today the Bollinger bands are popular indicator in technical analysis. Many traders have created their own investment funds and got rich thanks to this financial instrument.
Description and settings of the indicator
The tool consists of three undulating strips, namely: (1) a simple moving average, (2) an upper one, and (3) a lower one with deviations of 2 standard positions. All three components operate in the same time period. Since the Bollinger bands are usually used on candles charts, the period in the indicator settings is equal to the number of candles.
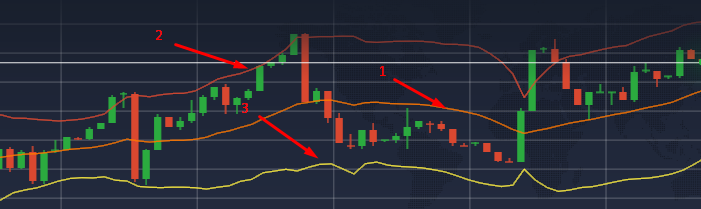
Components of the indicator
The value of period 20 is optimal for beginners. This parameter was set by default by John Bollinger. All setting the period value has already been completed, since this indicator was created within 10 years.
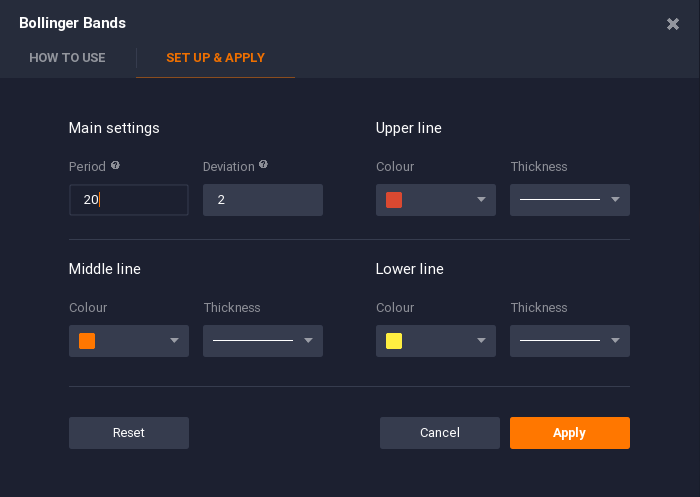
Bollinger Band Settings
Each graphic component of the indicator can be assigned an individual colour and line thickness. These functions make the bargaining convenient and adapted for the trader.
If all the parameters are set, click on the apply button to continue.
How does the indicator work?
This tool is similar to the channel of price volatility. This channel expands, and then narrows, signalling an upper or lower trend. You need to wait and not trade in a narrow corridor. You can start trading when the channel begins to expand.

The convergence and divergence of bands
A breakthrough the upper or lower limit of the Bollinger’s Corridor is the main signal for future expansion. In addition, according to this signal, you can determine the further direction of the price in order to place the bet correctly. A breakthrough or approach to the boundary line will mean a reversal of the trend in the opposite direction in most cases.

A breakthrough or approach of the price to the boundary line of the indicator
But this signal works best when there is no clearly defined trend. You can open a second screen with a large timeframe and draw a trend line to determine it. When the trend is defined, a breakthrough candles will mean trend continuation. This is also called a price walk along the boundary line.
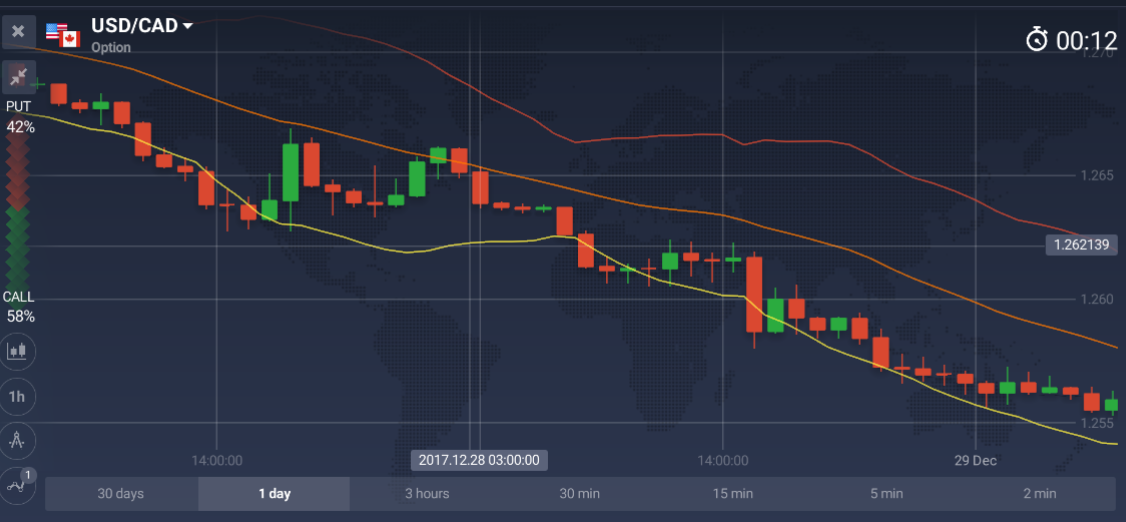
The trend continues. Price walk along the lower Bollinger band
When the trend grows or falls, breakouts or approaches to the boundary line are convenient for bets.

Points for betting
How can you determine that one trend has ended and will soon change? A clear signal is the intersection of the indicator’s midline and the transition of the price trend to the other half Bollinger’s Corridor and the narrowing of the side lines. At this stage, it is better not to trade with this indicator or use other tools of technical analysis.

Change of a falling trend on the sideway trend
Here the general principles of the operation of this financial instrument are described. Before you use the Bollinger bands, you need to carefully study its behaviour in real-world graphics and choosing the appropriate trading strategy. In this case, there is no need to build a new spacecraft, because all the strategies have long been tested and time-tested. In the author’s work of John Bollinger there are all the details about this financial instrument.
![]()
NOTE: This article is not an investment advice. Any references to historical price movements or levels is informational and based on external analysis and we do not warranty that any such movements or levels are likely to reoccur in the future
GENERAL RISK WARNING
The financial services provided by this website carry a high level of risk and can result in the loss of all your funds. You should never invest money that you cannot afford to lose.


