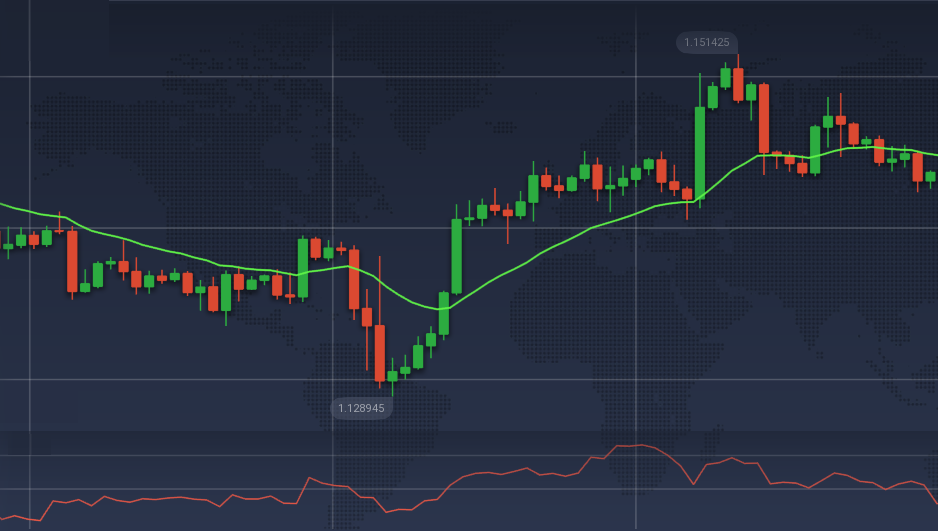
The system of technical indicators EMA and Momentum is well proven in the trend trading on Forex. Instruments work well with any assets on timeframes of 30 minutes or more. This trading system is popular with traders with different levels of training, since there is no need for special knowledge. Traders will be able to trade profitably on the IQ Option platform due to simple requirements and reliable signals from the strategy.
Category: Strategies

Trading strategy “ADX + EMA”
Trading strategy with oscillator ADX and trend indicator EMA is popular among traders in currency markets. It is suitable even for novice to trade. The logic of the ADX + EMA strategy is to trade when the price rolls back from the main trend.

Trading Strategy “Parallel Channels”
Parallel channels are a simple but effective approach to trading in different markets, timeframes and platforms, including IQ Option. The strategy involves graphic analysis instruments which available to each user. Trader will need for successful trading with “parallel channels”: a general understanding of the market, knowledge of the trading platform, ability to use trend lines and competent risk management.

Fibonacci levels. How to draw and correctly apply the instrument
Fibonacci levels are a classic instrument of technical analysis that designed to measure price fluctuations based on Fibonacci sequence. Users draw this instrument manually. Traders often use Fibonacci levels as resistance and support lines, as well as for finding profitable points of opening trading positions and completing trades.

Profitable trading strategy based on the moving average and the DPO indicator
According to the creator of the indicator, the analysis of micro-oscillations inside the trends in the long term gives a more accurate forecast than the analysis of the full trends. It is on this concept that the work of the Detrended Price Oscillator, DPO, is built. The indicator is controversial. There is no clear opinion about that in the community of traders. However, DPO shows phenomenal results in combination with a moving average and a simple trading system. The effectiveness of the strategy keeps at the level of 60-80% of profitable trades in stable markets. You will learn how to trade using the combination of DPO and SMA indicators on the IQ Option platform from this article.


