
John Ehlers developed the Center of Gravity (COG) indicator in 2002 to identify potential turning points in the price as early as possible. Many traders have yet to learn how to use it and some mistake it for the Stochastic, but they are completely different.
Being a leading indicator, the Center of Gravity is used to anticipate future price movements and to trade on price reversals. However, just like other oscillators, the COG indicator returns the best results in range-bound markets and should be avoided when the price is trending. Compared to the RSI or Stochastics, the Center of Gravity indicator has no overbought and oversold levels.
The IQ Option platform offers CoG indicator among the standard tools in the menu.
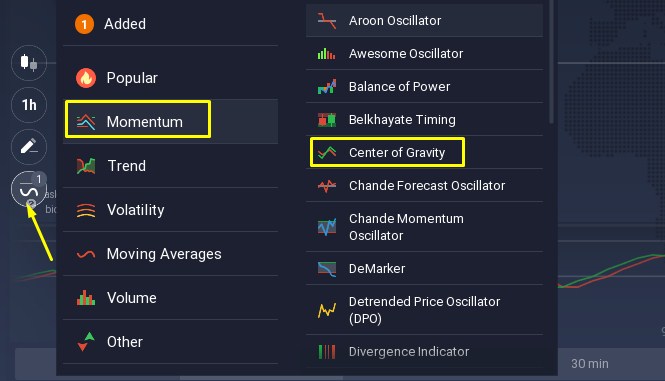
The CoG Indicator Appearance and Settings
Like most momentum oscillators, the CoG appears on a chart in a separate window below the price chart.

There are many indicators based on several moving averages but it has nothing to do with Ehlers’ Center of Gravity. Keep in mind that there are many versions of the COG indicator which differ by how they plot the indicator on the chart, but the basic principles of the indicator’s calculation apply to all of them.
The formula of the COG indicator is simple. It represents the ratio of the current price to its average value for a particular period.
The formula used to calculate the COG indicator is shown below:
COG = SUM of closing prices Pn x (n+1) / Sum of closing prices Pn
The standard settings of the indicator are the last 10 periods’ closing prices and a 3-period simple moving average of the COG, however you can adjust these settings to fine-tune the trading signals that the indicator returns.
The COG consists of two lines and is based on the sum of prices over a specified period. A simple moving average of the COG is plotted along the indicator to act as a signal line which generates buy and sell signals.
How to trade with Center of Gravity?
The Center of Gravity indicator is based on a simple calculation that takes into account the closing prices of the last n periods, and generates straight-forward trading signals based on a crossover strategy. The 3-period simple moving average is used as a signal line to enter with a buy or sell order.
Use the COG indicator to identify the following signals:
- Exit from the “OVER” Zones. A buy signal is triggered when the COG line crosses above the signal line, while a sell signal is triggered when the COG line crosses below the signal line.

- Crossing signal lines. This strategy is ideal for short-term trading. Buy in the direction where the fast (red) line crosses the slow (green) line.

- Divergence. The peak values on the chart diverges from those on the indicator itself. The deal is opened towards the direction of the indicator.

It is recommended to set the expiration equal to three candles.
You can notice the absence of lag between the price and the indicator. This is a huge advantage of the COG indicator, which helps spot turning points in the price as early as possible. You can simply add several indicators to your chart and wait for strong conditions (ADX<25 and COG crossover) before placing a trade. It ensures that you don’t place trades based on the COG crossover during trending market conditions and helps to avoid many of the false signals.
NOTE: This article is not an investment advice. Any references to historical price movements or levels is informational and based on external analysis and we do not warranty that any such movements or levels are likely to reoccur in the future.
GENERAL RISK WARNING
The financial services provided by this website carry a high level of risk and can result in the loss of all your funds. You should never invest money that you cannot afford to lose.


