
Trading demands access to some of the most complex financial services and instruments in the marketplace. Technical analysis tools like indicators and oscillators are necessity for most traders relying on technical indicators or swing trades rely more on software than news.
The Rainbow Oscillator calculates and displays the highest high and the lowest low of one or more simple moving averages to determine market trends. The oscillator curves are created based the moving average calculations. The high and low oscillator curves are color-coded in the chart, and market trends can be determined based on the width of the curves. It has lower noises and better visualization comparing to simple stochastic.
The Rainbow Oscillator was developed by Mel Widner 1997. Despite its simplicity, it became a popular tool among traders who use it for quick trades. IQ Option Broker offers the Rainbow Oscillator in the standard selection.
How to set up the Rainbow Indicator?
The core of the Rainbow Oscillator is a 2-period Simple Moving Average, to which recursive smoothing is applied. This way nine other moving averages are created, with each new one being based on the previous moving average. A total of ten moving averages is created, which appear in the form of a rainbow, when plotted on a chart.
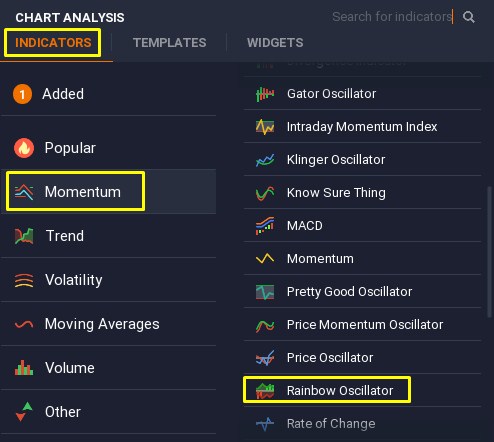
To activate Rainbow Indicator in your IQ Option trading platform, click on its indicator name.

Some say that the Rainbow Oscillator is similar to Bollinger Bands, others say they have nothing in common. You will have to find the answer to this question on your own.
Experts recommend the following settings for the Rainbow Indicator in IQ Option trading terminal:
- Set period – 2;
- Set deceleration HH / LL – 10;
- Watch closing prices.
How to spot trend reversals using the Rainbow Oscillator?
Rainbow is a trend-following indicator. It determines the highest high and the lowest low of these moving averages. The Rainbow Charts and the Rainbow Oscillator are basically one and the same indicator, with the only difference between them being the way they are visualized.
As the Rainbow width becomes larger, this indicates that the present trend may be continuing, while if the oscillator shows a reading above 80, the market may begin showing signs of instability. The stage is set for a reversal.
If the price tends to approach the Rainbow and the oscillator line tends to be flatter, this suggests that the market tends to show signs of stability. The oscillator bandwidth will narrow. In case, however, the oscillator reading falls below 20, this implies that the stage is again set for a market reversal. The market is stable, when the oscillator readings are between 20 and 80.

How to trade turbo options with the Rainbow Oscillator?
The Rainbow Oscillator is used by traders for scalping. Scalping is a trading style that specializes in profiting off of small price changes. This generally occurs after a trade is executed and becomes profitable. Scalping requires a trader to have a strict exit strategy because one large loss could eliminate the many small gains the trader worked to obtain. In this case
CALL when the green bar crosses the upper border of the channel
PUT the green bar crosses the lower border of the channel

The expiration period should be less than the formation of one candle.
Timeframes for turbo option should be less than 1 minute.
As we mentioned that the Rainbow Oscillator indicator is derived from a consensus of trends that has the appearance of a rainbow when it is plotted in color. Traders use this for getting buying and selling signals, as well as determining overbought and oversold positions. In conclusion, everyone can invest successfully in the market as long as they have the little programs that help create the easy to read and self-sufficient financial indicator charts.
NOTE: This article is not an investment advice. Any references to historical price movements or levels is informational and based on external analysis and we do not warranty that any such movements or levels are likely to reoccur in the future.
GENERAL RISK WARNING
The financial services provided by this website carry a high level of risk and can result in the loss of all your funds. You should never invest money that you cannot afford to lose.


