Binary option traders know that the asset price never goes in one direction all the time. The trading chart shows changes and fluctuations because of changes in supply and demand. It is the foundational law of trading and it is understandable. Nobody buys assets all the time: there is time to sell for profit. Sooner or later there will be a price at which one will want to sell it. The same is true with the downward movement: traders want to get rid of depreciating assets.
All traders know how to see and read the overbought and oversold zones. That is why those two zones are important to note in the technical analysis. You should learn more and use the Disparity Index.
The Disparity Index is available among the standard tools of the IQ Option platform, but it is used here in a simplified form. Therefore, it is recommended to switch to the MT-5 terminal with its full version.
More about the Disparity Index
Without exaggeration, the Disparity Index is the best tool for determining the “overbought/oversold” zones. Why? Because it was created for this purpose. Disparity means Inequality thus the name of the indicator. It reads the current trend and signals the dominance of buyers or sellers. The moving average for a certain period is used as the basis of the Disparity indicator, as well as of the majority of expert tools and instruments. It is recommended to use the time frame of 10.
The formula is as follows:
DI = (current price – MA(n)) / MA(n) × 100, where MA(n) is a moving average for a certain period.
If you are not mathematically gifted, do not fear – no manual calculations are required. After you click on the tool, a histogram with two lines will appear in a separate window in the MT-5 terminal or simply zero level with a signal line in the trading platform from IQ Option.
How to trade with the Disparity Index
Figuring out the signals of this indicator is quite simple. If we are talking about the trading platform IQ Option, then here we need to keep an eye on the signal line.
If it is above zero level, this means that buyers prevail in the market. If it is the opposite, then the sellers prevail. However, if the moving moves away from the level, it can indicate a reversal.
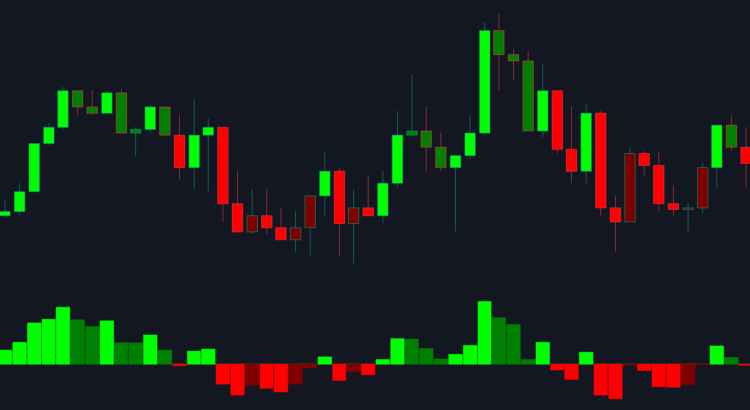
This tool is much more convenient for MT-5. Here we are interested in the histogram that is colored in red (if under the zero level) and in blue (if over it). At that, as soon as the market is overbought, the bar becomes dark blue, and when it is oversold, it becomes dark red.

Consequently, there are the following options for trading:
Buy a CALL contract when the bars are above the key level and colored blue (not dark blue) or when the histogram is under zero and the bar is colored dark red. In this case it is safe to open a deal only after the third column of dark red color.

It looks like the following for oversold market:

The PUT option, on the contrary, is acquired when the histogram is under the chart (if there are no dark red bars) or above, when the third dark blue bar appears.

It looks like the following for overbought market:

The expiration time should be three bars when trading along the trend, and four or five bars when trading on the reversal.
Once the price is excessively pushed in one direction, there are very few investors to take the other side of the transaction when the participants wish to close their position, ultimately leading to a price reversal. So the disparity index is a good indicator in warning when a trending market is getting to an extreme. Just like other momentum indicators, a trader should use the disparity index indicator in conjunction with other tools when trying to spot possible reversals or confirm a trend.
NOTE: This article is not an investment advice. Any references to historical price movements or levels is informational and based on external analysis and we do not warranty that any such movements or levels are likely to reoccur in the future.
GENERAL RISK WARNING
The financial services provided by this website carry a high level of risk and can result in the loss of all your funds. You should never invest money that you cannot afford to lose.


