
Trading on trends is one of the most effective strategies. In stable markets, this tool is the base of any stock trader, but since the specifics of binary options require additional analysis, the forecast must be checked using indicators before the transaction is executed. Here comes the Parabolic SAR.

The parabolic SAR was developed by Wells Wilder. It is a trading system based on information on prices and time. The indicator shows the tendency of price changes in the market, thereby helping to determine when the “bullish” microtrend will change to “bearish”. Parabolic SAR is a self-sufficient tool, but to improve the accuracy of forecasts it can be combined with auxiliary indicators.
Trading Rules with Parabolic SAR
The main task of the trader is to find a suitable signal for opening a deal on the basis of Parabolic SAR. As soon as the desired signal appears on the chart (see screenshot), turn on the auxiliary indicator immediately to confirm the original forecast.

Note that Parabolic SAR and MACD often give conflicting estimates, so for stable operation, you need to combine different auxiliary indicators. Since the IQ Otion platform allows you to include two or more indicators simultaneously, you do not have to dig into the settings every time you notice a signal. Just turn on the necessary indicators and they will work in real time, complementing, rather than interfering with each other and mixing with each other.

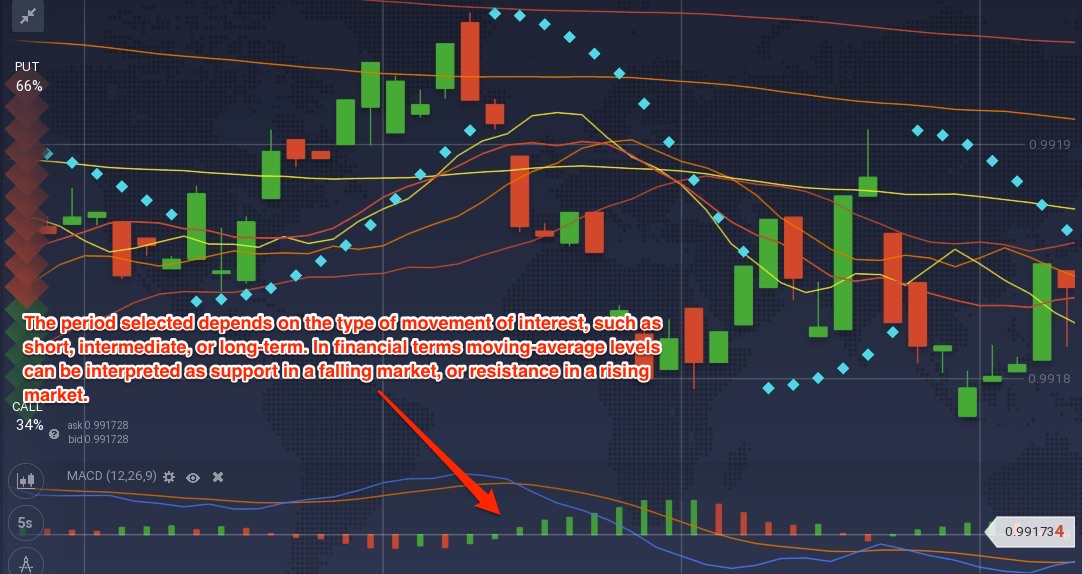
Advice: Before trading on the selected asset, take a look at the current chart and compare it with the moving average. If the quotes are above the indicator, look for the opportunity to enter a longer position. Use strategies for trading with a long closing period or go to another asset.
Work of Parabolic SAR and auxiliary indicators on specific examples
Look at the example. The chart shows the EUR / USD pair with an interval of 5 minutes. Activated indicators are: MACD, EMA and Parabolic SAR. As you can see, the current price is lower than EMA. Usually this is an indicator that you need to close the pair. Looking at the parabolic indicator, we also see an alternating signal for the SAR. This same hypothesis is confirmed by a pool on the MACD indicator. Consequently, this pair is ripe for closure on a short period. In this situation, a trader must open a PUT-option with a validity period that fits into a 5-minute interval.

Important: always ensure that the deal closes no later than the end of the conditional 5-minute barrier. If the necessary signal appeared on the second minute of the time interval, put in the settings from one to three minutes. If the third – it is from one to two minutes, etc. At the same time, the interval does not have to be a five-minute interval. It can be scaled as you like with the change in the indicator settings.
We increase the accuracy of forecasts: the analysis of individual “candles”
Trading on the basis of standard indicators often requires the analysis of individual candles. For example, if a candle closes inside a peak trend, it is a signal that a turn can happen. For this hypothesis to be confirmed, the next candle should close in the opposite direction.

Look at the example. We have an AUD / USD chart for a 5-minute interval. You can see that the price is above 200 EMA. We also see that one of the five-minute candles is closed between the boundaries of the two indicators of the Bollinger band. This is usually a good indicator that you need to pass a pair, ready to turn.
However, to confirm the trade, the trader must study the next candle. In respect that the next 5-minute candle has really changed, the trader can now make a deal and make a profit. In this case, an option with a CALL status is opened with the transaction closing after 4 hours.

![]()
NOTE: This article is not an investment advice. Any references to historical price movements or levels is informational and based on external analysis and we do not warranty that any such movements or levels are likely to reoccur in the future
GENERAL RISK WARNING
The financial services provided by this website carry a high level of risk and can result in the loss of all your funds. You should never invest money that you cannot afford to lose.


